
October 2025 Market Commentary

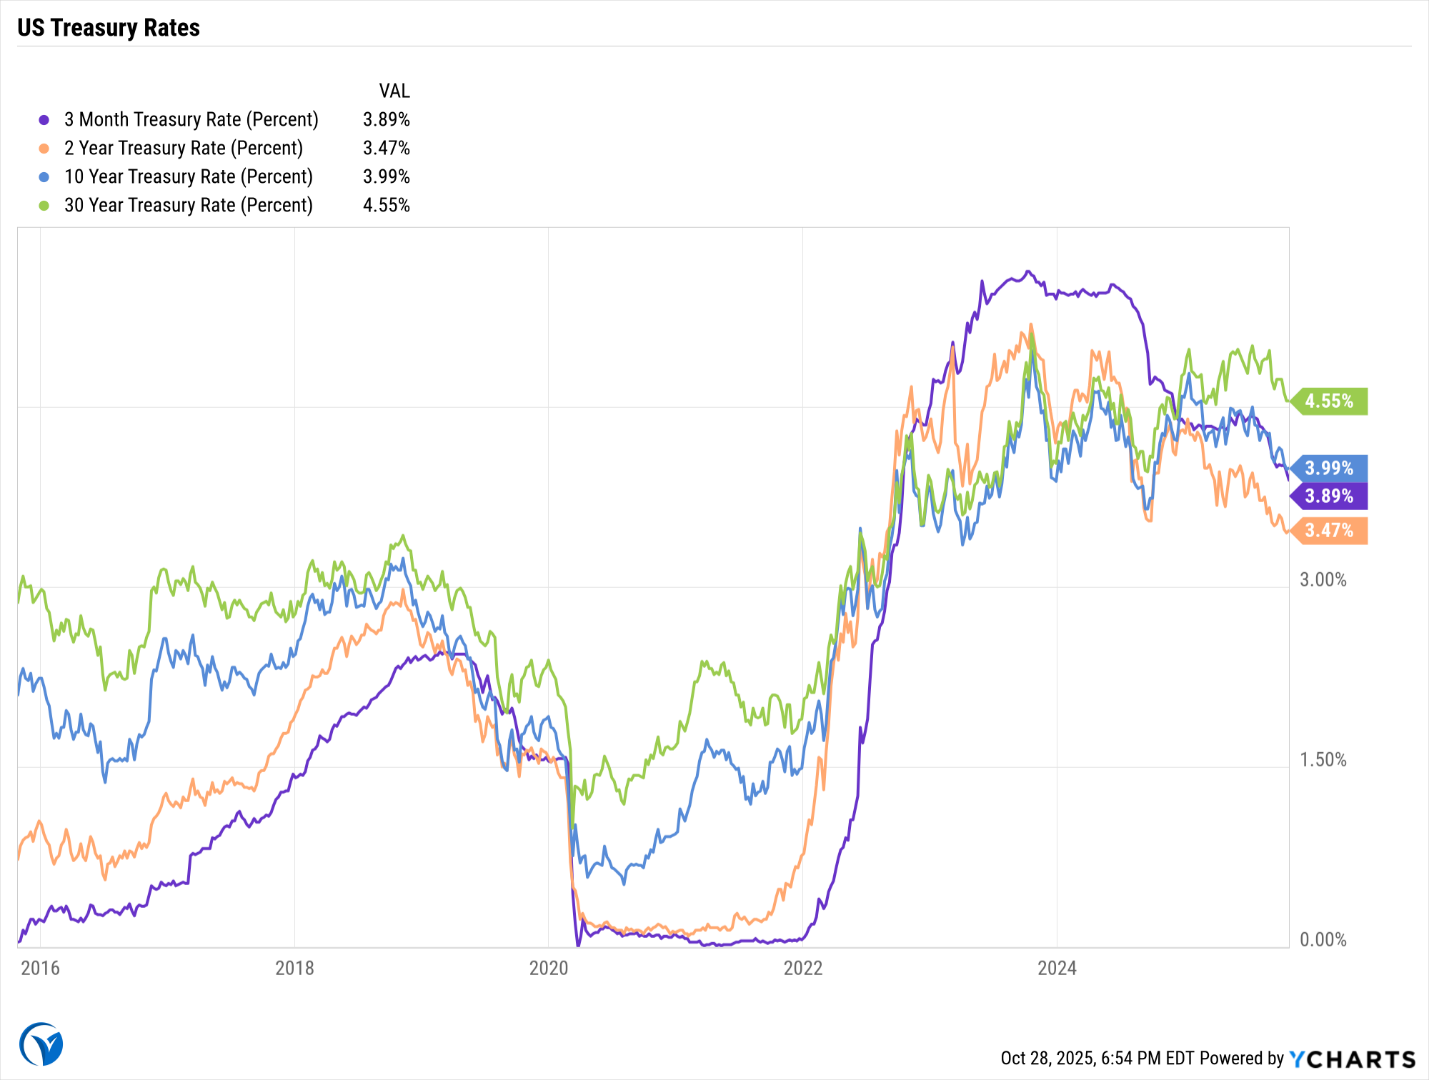
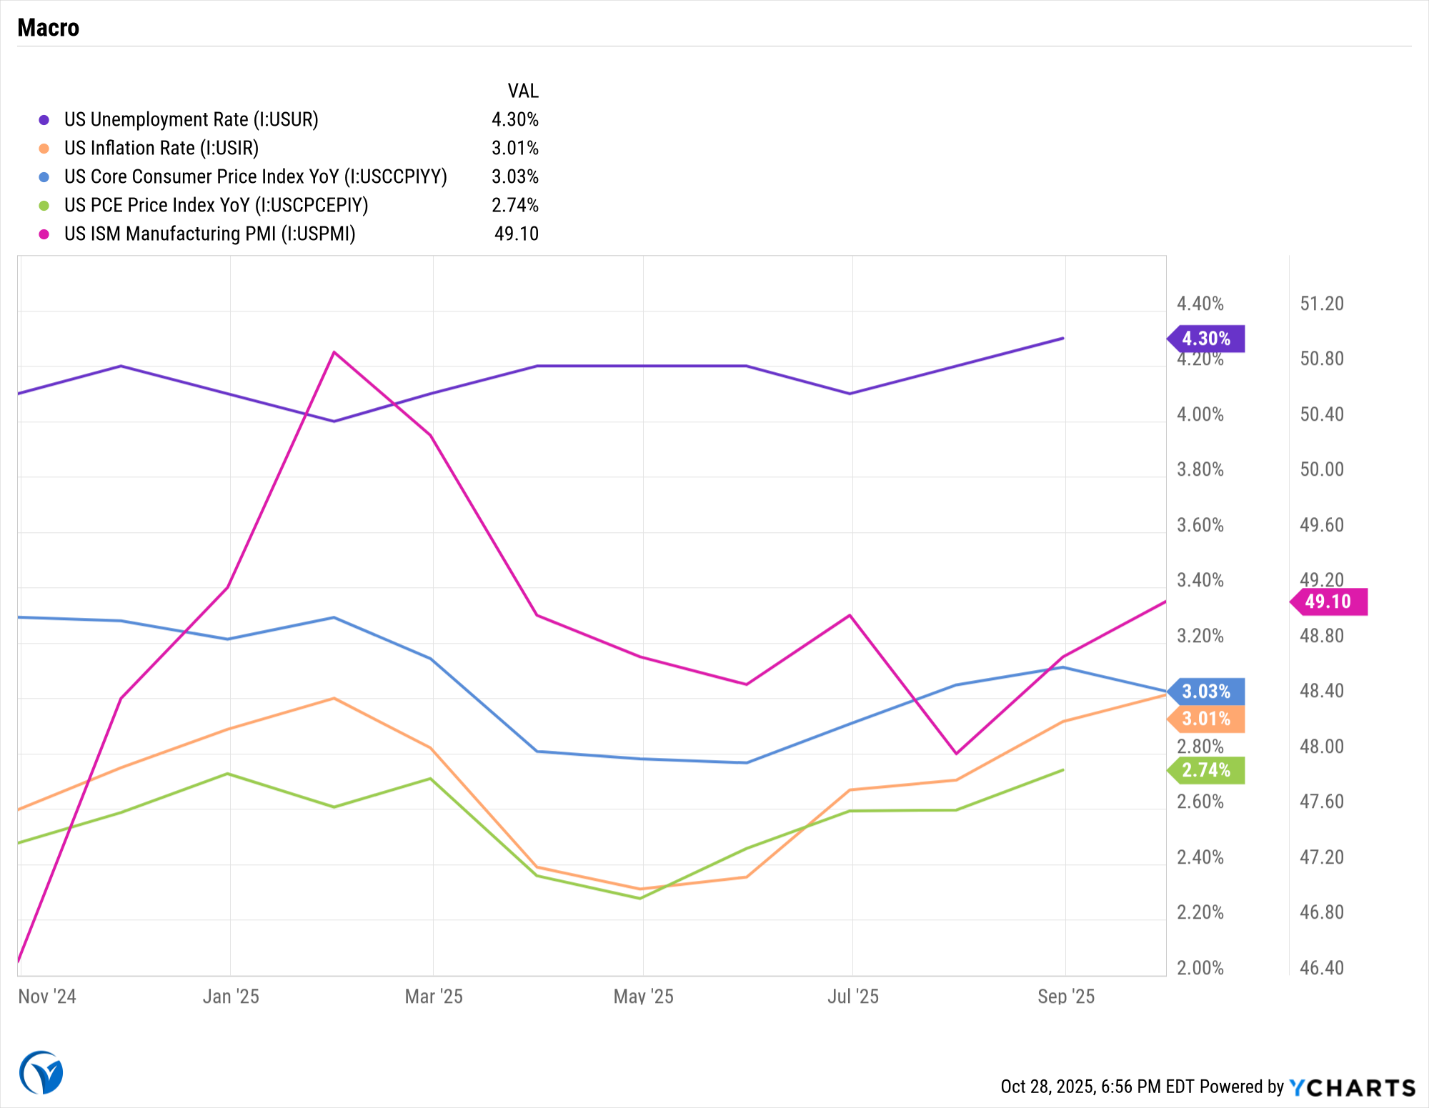
The Federal Reserve delivered its anticipated second interest-rate cut of 2025, extending an easing cycle aimed at cushioning a cooling labor market amid mixed economic signals. Policymakers lowered the federal funds rate by 0.25% at the October FOMC meeting, bringing the target range to 3.75%–4.00%. Chair Jerome Powell framed the move as “risk management,” balancing elevated unemployment (around 4.3%) against persistent inflation near 3.0% year-over-year. Despite the more accommodative stance, investors face a complex backdrop of tariff-driven price pressures and stretched equity valuations.
Fed Maintains Easing Bias While Signaling End to Balance Sheet Runoff
Alongside the rate cut, the Fed signaled it will end quantitative tightening as reserves approach “ample” levels, aiming to avoid money-market stress reminiscent of 2019. Powell emphasized a data-dependent approach but acknowledged that the government shutdown has created a data void, forcing greater reliance on private indicators. A December cut remains possible if conditions warrant, though some regional presidents have cautioned against extending easing into 2026. Market pricing implies further reductions in the policy rate into early 2026, broadly pointing toward a 3.25%–3.50% terminal range.
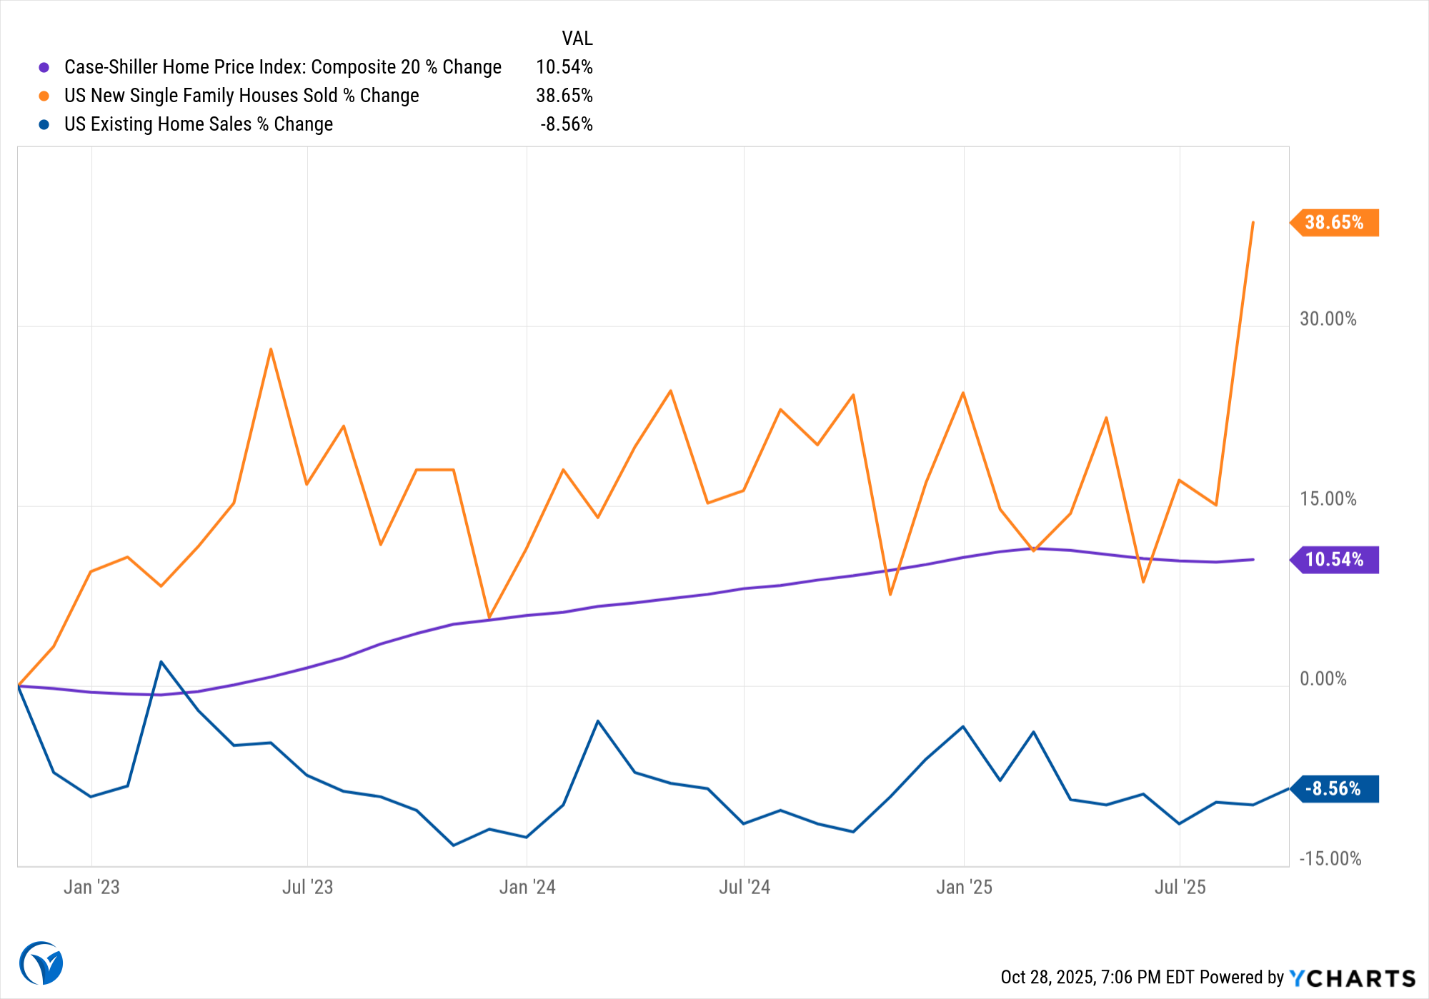
Housing Market Faces Persistent Headwinds Despite Rate Relief
Mortgage rates fell to about 6.19% on the 30-year fixed—lowest in over a year—spurring a ~60% surge in refinancing activity. Even so, existing home sales hold near 4.0 million (annualized), well below pre-pandemic norms, as affordability remains strained: the typical mortgage payment >35% of median household income. Inventory has improved to roughly 4.6 months of supply, with the Northeast showing relative resilience while parts of the Sun Belt, notably Florida, continue to see price softness. Housing starts slid 8.5% in August to a 1.307 million annual pace as builders cite demand uncertainty and volatile input costs (lumber/steel) amid tariff disruptions.
Tariff-Driven Inflation Complicates the Fed’s Dual Mandate
Headline CPI reaccelerated to 3.0% YoY in September (from 2.9% in August). Core CPI held near 3.0%, with Fed officials estimating ~0.3–0.5 percentage points of recent inflation attributable to 2025 tariff hikes. The effective U.S. tariff rate is now near 18%, the highest since the 1930s. Goods categories such as apparel, furniture, and electronics have seen the sharpest increases; post-substitution, prices are still expected to remain meaningfully higher than pre-tariff levels. Surveys show firms absorbing a majority of tariff costs via margins rather than fully passing them through, helping cap near-term inflation but pressuring profitability. Upstream, ISM Prices remains elevated, signaling continued pipeline cost pressures.
Labor Market Shows Continued Deterioration Amid Structural Shifts
With official BLS reports delayed, alternative indicators suggest unemployment hovering near 4.3% and weaker job-finding rates for unemployed workers alongside higher separation rates. Job postings have declined year over year, particularly in tech and professional services. Large employers continue to pursue workforce reductions, and a federal “rightsizing” initiative has led to >200k cumulative departures in 2025. Youth unemployment is estimated above 11%. Consumers are turning cautious: retail sales growth has cooled and holiday spending is projected to decline ~5% year over year. The divergence between solid GDP and soft employment points to productivity gains (including AI/automation) masking underlying labor demand weakness.
Precious Metals Consolidate After Parabolic Rally
After posting record highs earlier in the month, gold and silver saw sharp mid-October pullbacks. Gold fell from above $4,300/oz to the high-$3,900s–$4,000 area, including its largest one-day drop since 2013. Silver slid ~8% in its worst session since 2021, retracing from above $50/oz into the $47–48 range. Year-to-date, however, gold remains ~+55% and silver ~+65%. The physical silver market appears extremely tight: persistent backwardation, spiking lease rates (reportedly touching the high-30% annualized area), and logistics workarounds (e.g., airfreight between hubs). Central-bank gold buying remains near record paces, underpinning bullion despite technical volatility. Banks’ medium-term targets stay constructive (e.g., silver mid-$60s by 2026; gold nearer $4k–$5k by 2026).
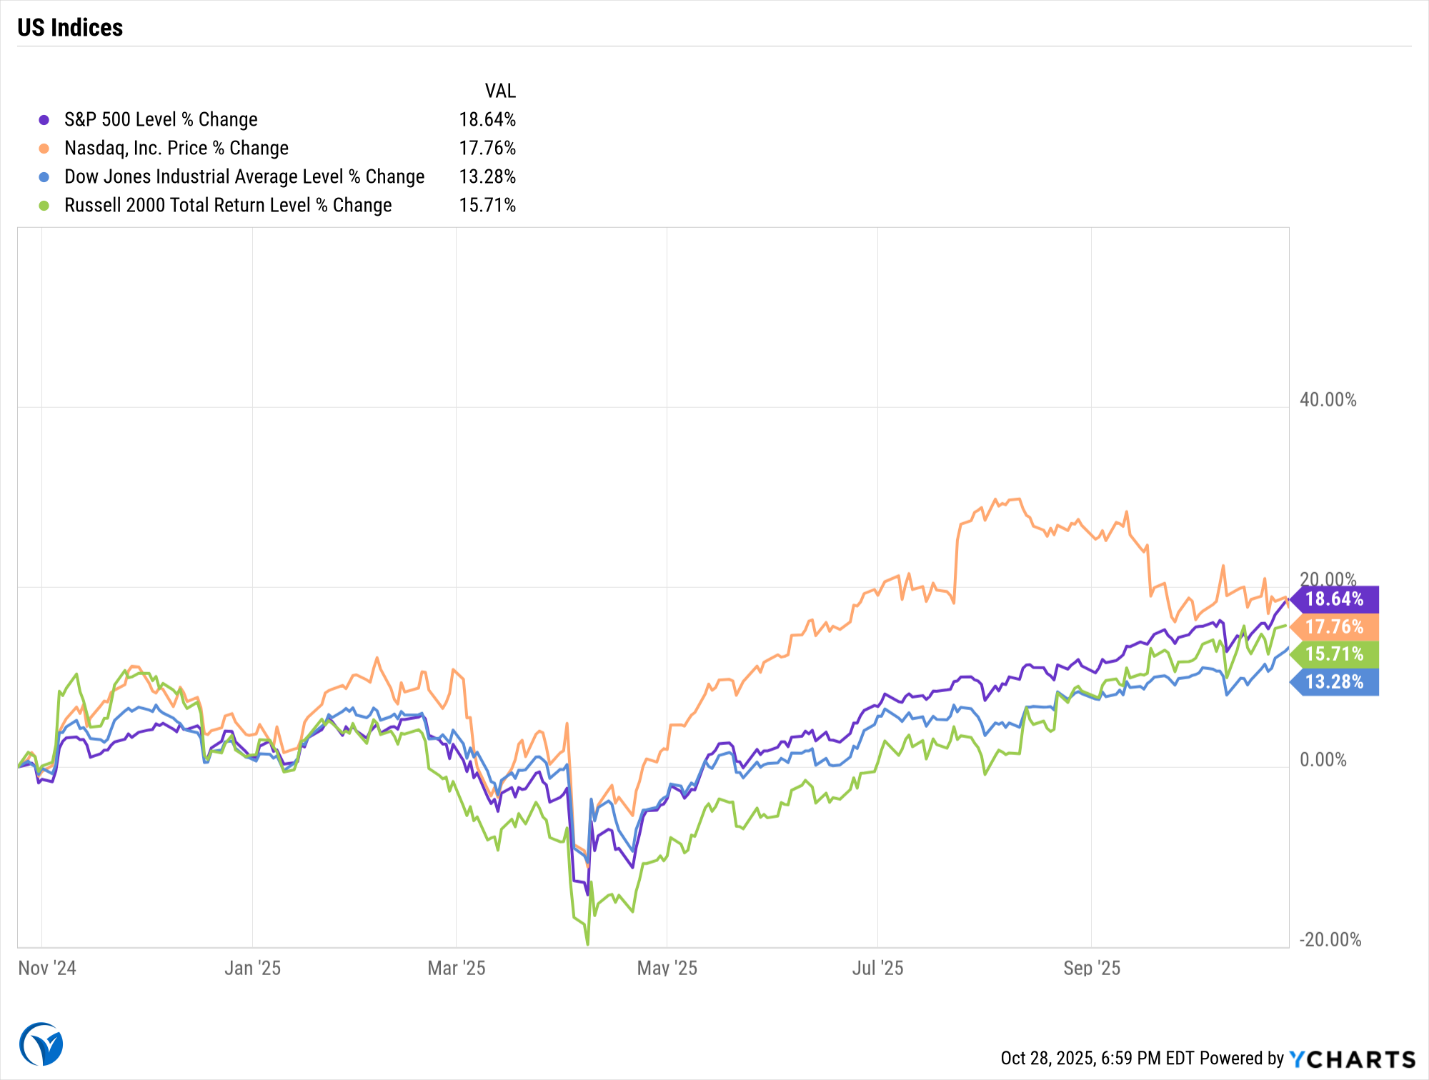
Equity Markets: Valuation Extremes, Narrowing Breadth
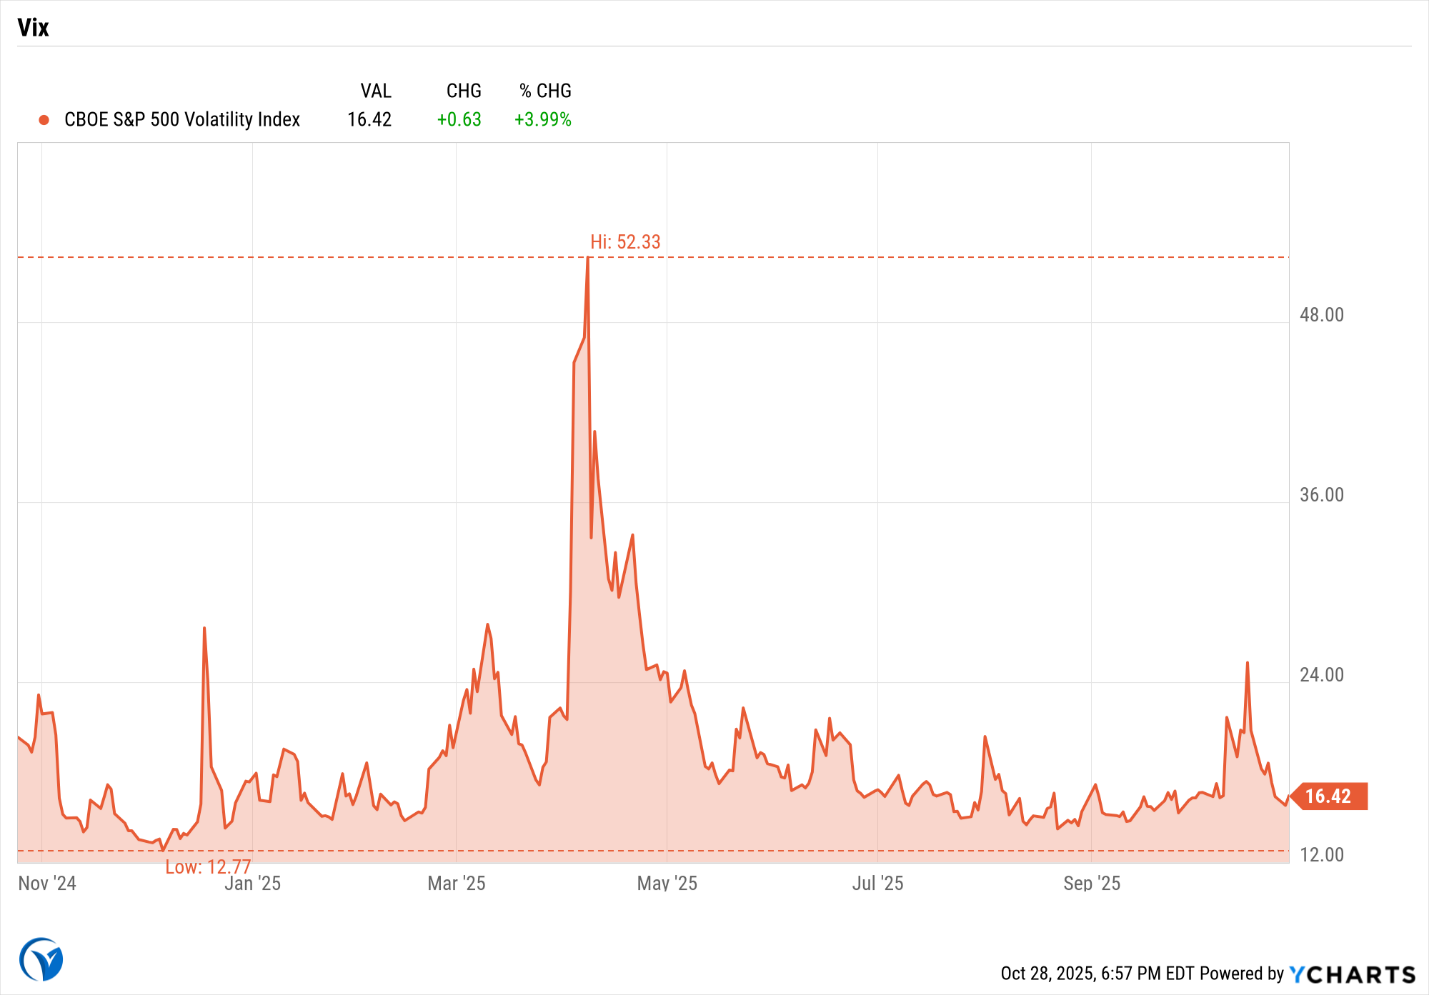
The S&P 500 set fresh highs near 6,875 (about +15% YTD). Forward P/E ~23× sits well above 5- and 10-year averages, and several major “bear market signposts” (e.g., rich valuations, tight credit spreads, weak breadth) are flashing caution. Market performance remains exceptionally narrow, driven by mega-cap AI/tech leaders (the “Magnificent Seven”), which have contributed the lion’s share of gains and capital-expenditure growth. Meanwhile, value sectors and small caps lag markedly. The VIX ~15 signals complacency; IG credit spreads remain near cycle tights (<1%). Early Q3 earnings show a high beat rate but below-average surprise magnitudes, with profit growth concentrated in tech and financials.
Government Operations and Policy Uncertainty
The federal government shutdown—now beyond four weeks—has halted key data releases and complicated both private-sector planning and Fed policy assessment. While markets have been resilient, estimates suggest a ~0.1% of GDP drag per week of shutdown, much of which may be recouped post-reopening, but risks rise as the impasse lengthens. Operational strains are mounting: agencies face disruptions, and a potential lapse in SNAP benefits if the shutdown extends further would weigh on vulnerable households. Policy negotiations remain stalemated, and volatility could increase if the data blackout extends toward the mid-December FOMC.
International Trade Dynamics and Tariff Escalation
October saw renewed U.S.–China trade tensions following public criticism of Chinese commodity purchases. The effective tariff rate ~18% continues to weigh on supply chains, with firms passing through ~one-third of tariff costs to consumers and absorbing the rest in margins. Some relief emerged as Japan finalized a trade arrangement trimming tariffs in select categories, while U.S.–EU discussions stalled amid threats of reciprocal measures. Substitution away from China (e.g., to Vietnam/Mexico) is progressing but incomplete; long-run price impacts should moderate as supply chains adapt, though near-term pressures remain acute.
Conclusion
October underscored a late-cycle landscape where accommodative policy coexists with elevated inflation, labor-market softening, and stretched valuations. The Fed’s second cut and early end to runoff provide a monetary cushion, but tariff-related inflation and narrow market leadership heighten fragility. With a data blackout complicating policy and corporate planning, the risk-reward in equities looks increasingly asymmetric: momentum remains a tailwind, yet the prevalence of classic late-cycle markers argues for quality, diversification, and disciplined risk management. Expect higher volatility into year-end as policy, growth, and earnings narratives collide; avoid concentration in the market’s narrow leaders, stress-test exposures to inflation/rates, and keep dry powder for dislocations
Securities offered through Registered Representatives of Cambridge Investment Research, Inc., a broker/dealer, member FINRA/SIPC. Advisory services through Cambridge Investment Research Advisors, Inc., a Registered Investment Advisor. Cambridge and Vera Planning are not affiliated. The information in this email is confidential and is intended solely for the addressee. If you are not the intended addressee and have received this email in error, please reply to the sender to inform them of this fact. We cannot accept trade orders through email. Important letters, email, or fax messages should be confirmed by calling (678) 250-5099. This email service may not be monitored every day, or after normal business hours.
These are the opinions of [rep/author name] and not necessarily those of Cambridge, are for informational purposes only, and should not be construed or acted upon as individualized investment advice. Indices mentioned are unmanaged and cannot be invested into directly. Past performance is not a guarantee of future results.